Understanding AI Decisions: The Role of Explainable AI

Uncover how Explainable AI transforms black-box models into transparent systems. Explore its role in trust, ethics, and smarter decision-making for the future of AI.
Imagine an AI that explains itself. That’s the goal of Explainable AI (XAI). XAI refers to techniques that make a machine learning model’s decision understandable to humans.
Instead of a “black box” that spits out a label or score, AI services shines a light on why the model made that decision. This is crucial in deep learning: state-of-the-art NLP and image-recognition models (like those classifying text or medical images) are extremely accurate but often opaque.
Without explanations, doctors, regulators or even end-users can’t trust or verify an AI’s output. In fact, AI researchers note that many models today lack any way to explain their reasoning, limiting trust and adoption.
By revealing the model’s logic (for example, showing which words or pixels were important), XAI lets users inspect, validate, and trust AI decisions in high-stakes domains like healthcare and finance.
Black-Box AI vs Explainable AI
Here’s how the two approaches differ when it comes to explainable artificial intelligence solutions:
Aspect | Black-Box AI | Explainable AI (XAI) |
Transparency | Opaque; internal logic hidden | Transparent; shows factors driving decisions |
Trust | Hard for humans to verify | Builds user confidence by explaining reasoning |
Compliance | Risky in regulated industries | Meets legal requirements (e.g., GDPR, AI Act) |
Use Cases | Research models, recommendation engines, experimental systems | High-stakes AI services in healthcare, finance, compliance-driven industries |
Trade-off | Often higher raw accuracy but no insights | Slightly more complex to implement but balances accuracy and interpretability |
In short, black-box AI prioritizes accuracy at the expense of transparency, while explainable AI makes predictions understandable and actionable. For organizations adopting AI development services or Generative AI solutions, XAI is no longer optional, it’s a foundation for accountability, fairness, and trust.
The Core Principles behind Explainable AI
As per US National Institute of Standards and Technology (NIST), here are the four principles to follow for an AI solution to be considered under explainable AI:
Explains the results with supporting evidence
Explanation should be completely meaningful, letting users finish their tasks based on it.
Clear and accurate explanations
System must operate within its pre-defined knowledge limits
However, some AI services can trade accuracy for the sake of explainability and that could be a problem in several implementations. An integral part of the AI TRiSM framework, explainability improves fairness, efficacy, reliability, governance, and privacy in AI models.
Real-world Examples of Explainable AI Services
Here are some of the ways in which explainable AI services are changing different industries
Healthcare – Diagnosis & Imaging:
Imagine an AI reading an X-ray or MRI to flag disease. With XAI, the system can highlight image regions that influenced its diagnosis. For example, studies show that when radiologists received heatmap explanations from an AI (e.g. highlighting suspicious lung regions on a chest X-ray), they found defects more accurately than with a blind AI report.
In one large study, both factory workers and doctors performed better on visual inspection tasks when given an AI’s heatmap explanation instead of only a black-box score. This kind of heatmap (sometimes produced by Grad-CAM or similar methods) shows which pixels or areas the CNN “looked at”, so doctors can check if the AI is focusing on the right region (e.g. highlighting an actual tumor instead of a harmless region).
Healthcare – Diagnosis Support:
In diagnosis support systems (like predicting disease from electronic health records or symptoms), Explainable AI tools (e.g. SHAP or LIME) can list which patient features or words in a report mattered most. For instance, a system might show that “blood pressure” and “cholesterol” had the biggest influence on a cardiovascular risk score. This transparency helps doctors feel confident using AI guidance and catching errors.
Finance – Credit Scoring & Loans:
Banks and insurers are using XAI to explain credit or loan decisions. Financial regulators already require explanations: by law (in the U.S.), lenders must give specific reasons when a loan is denied.
Explainable AI techniques like SHAP or LIME can produce exactly this, highlighting factors (such as high debt-to-income ratio or low credit history) that pushed the decision.
For example, an XAI report might say “Income too low” or “Credit utilization high” as the key reason for denial. These clear explanations not only build customer trust but also help detect unfair biases (e.g. if the model was secretly using a ZIP code proxy for race).
Together, these real-world cases show XAI boosting trust and transparency. In healthcare, doctors get to verify what the AI “sees” in an image. In finance, customers and regulators see the why behind automated decisions. In both areas, XAI bridges the gap between raw accuracy and human understanding.
Tutorial: Using XAI Tools in Python
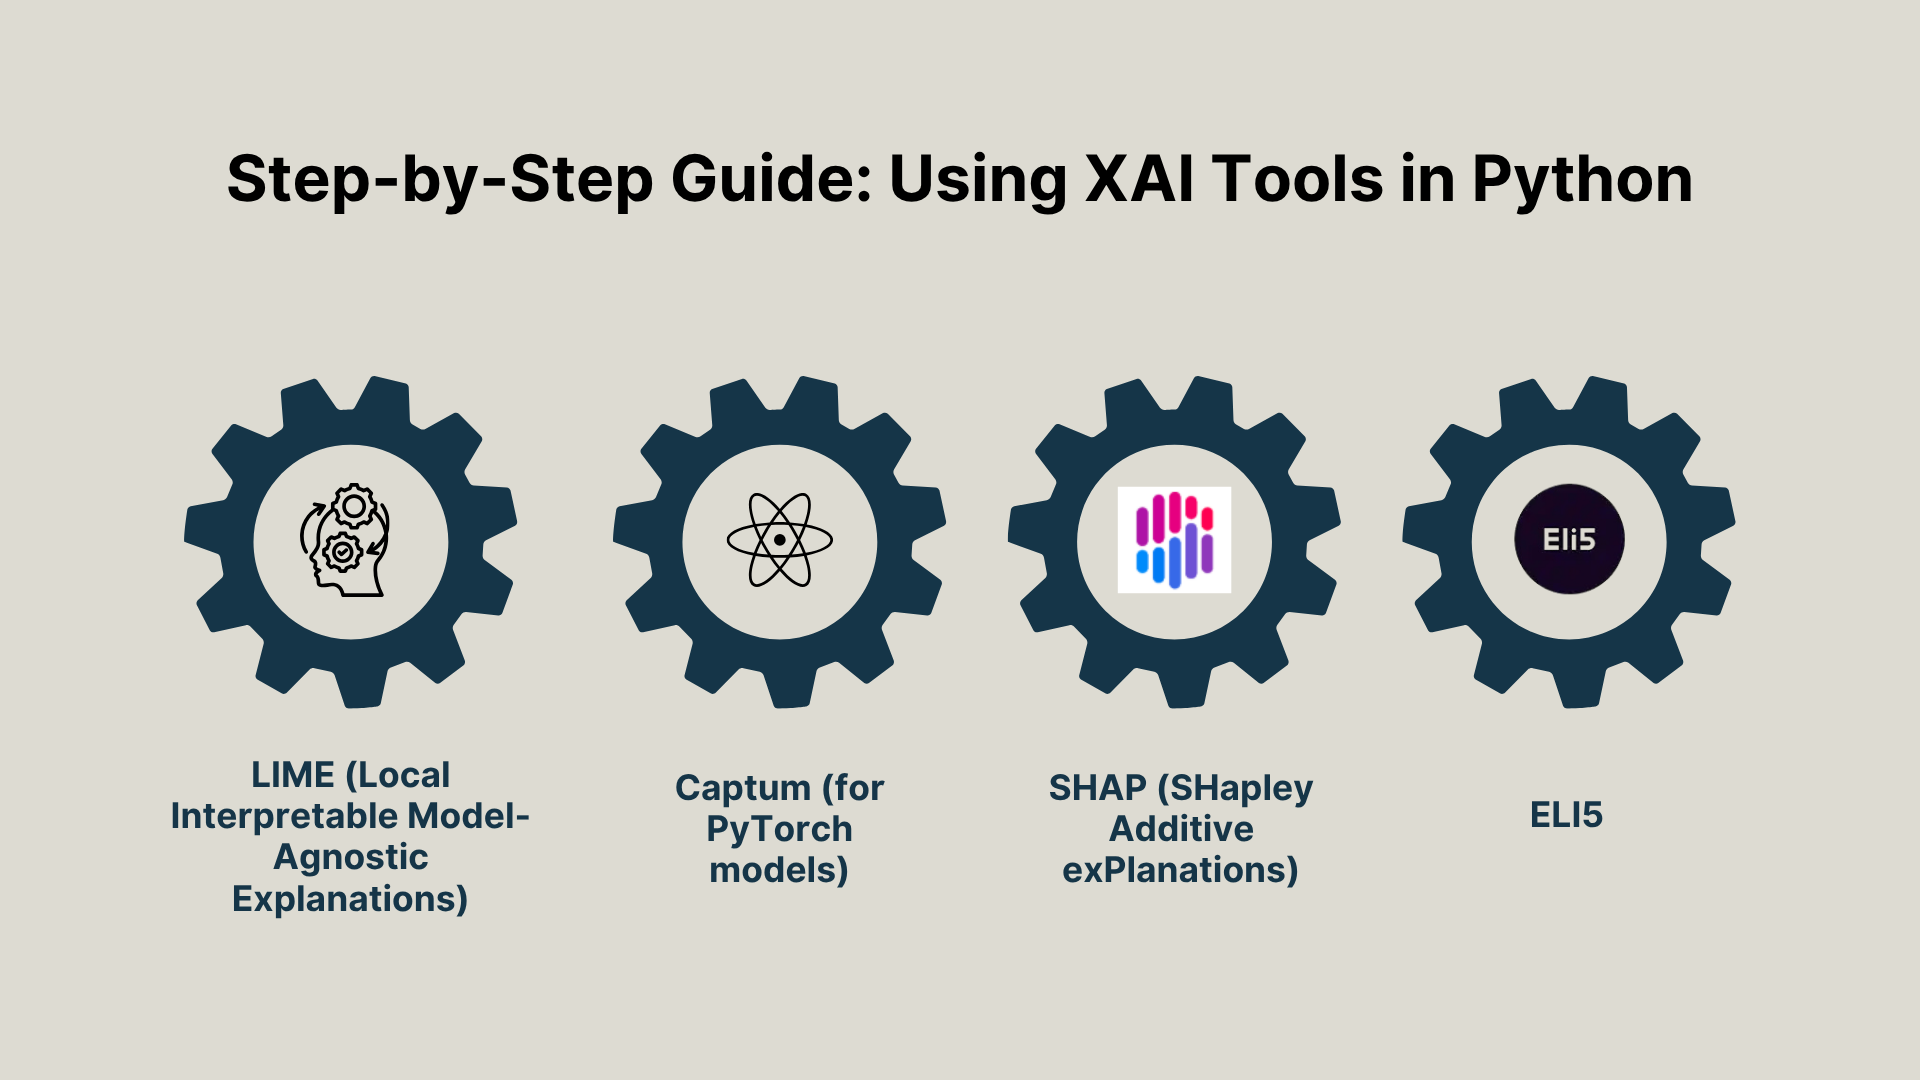
Data scientists have many open-source tools at hand. For example, the Python ecosystem supports popular libraries such as LIME, SHAP, Captum (for PyTorch), and ELI5. Below are simple examples of how these tools can provide explanations for a model’s prediction. (You can adapt them to your own models and data.)
LIME (Local Interpretable Model-Agnostic Explanations):
LIME treats the model as a black box and approximates it locally. For text, you might do:
from lime.lime_text import LimeTextExplainer
# Supposemodel.predict_probagives class probabilities for text inputs
explainer = LimeTextExplainer(class_names=['neg','pos'])
exp = explainer.explain_instance("This movie was fantastic",
model.predict_proba, num_features=3)
print( exp.as_list()) # shows which words pushed prediction + or -
This prints the top words influencing the model’s decision. LIME works similarly on images (by highlighting superpixels), or on any model input.
SHAP (SHapley Additive exPlanations):
SHAP values come from game theory and tell how much each feature contributes. For a tabular or NLP model:
import shap
explainer = shap.Explainer(model, X_train) # model and training data
shap_values = explainer(X_test) # get SHAP values for test set
shap.plots.waterfall(shap_values[0]) # visualize one prediction
For image models, one can use a gradient or partition explainer and then shap.image_plot(). SHAP also has summary plots that show overall feature importance across many examples.
Captum (for PyTorch models):
If you have a PyTorch CNN or transformer, Captum offers many methods (Integrated Gradients, DeepLIFT, etc.). For instance, to use Integrated Gradients on an input:
from captum.attr import IntegratedGradients
model.eval()
ig = IntegratedGradients(model)
attributions = ig.attribute(input_tensor, target=predicted_class)
Here attributions is a tensor highlighting which input features (pixels or tokens) most influenced the target class. Captum then allows you to visualize these attributions as heatmaps or word importance.
ELI5:
Originally for simpler models, ELI5 can show feature weights or prediction contributions. For example:
import eli5
from eli5.sklearn import PermutationImportance
perm = PermutationImportance(model).fit(X_val, y_val)
eli5. show_weights(perm, feature_names=X_val.columns.tolist())
This would display a bar chart of feature importances by measuring how shuffling each feature hurts performance. ELI5 also has show_prediction() to display how each feature value in a single instance pushes a prediction up or down.
These code snippets illustrate how easy it is to peek into a model. In practice, you’d insert your own trained model, data X_train/X_test, and adjust parameters.
As one source notes, the Python toolkit for XAI services is rich – with “SHAP, LIME, ELI5, Captum” among others to open up the black box.
Challenges & Solutions
Explainability isn’t easy, especially for deep models. Here are key challenges and how the field is addressing them:
Black-Box Complexity:
Deep neural networks (CNNs, transformers, etc.) often have millions of parameters. By default, their decisions aren’t transparent.
Experts warns that unlike simple “white-box” models (like linear regression) where inputs map directly to outputs, black-box models have “unobservable input-output relationships”.
We lack a clear path of how each input led to the output.
Solution:
We use post-hoc XAI methods (like LIME/SHAP/Grad-CAM) to approximate explanations. There’s also a push for intrinsically interpretable models (like rule-based or prototype networks) in sensitive domains or adding explanation constraints during training.
Trade-off: Accuracy vs Interpretability:
Simple models are easier to explain but might be less accurate. Complex models get better scores but are harder to interpret. DARPA explicitly frames this as a “performance-versus-explainability trade space”.
Dataiku similarly notes that “a key challenge… is figuring out how to balance model performance and interpretability”.
Solution:
Researchers are exploring ways to have both: using techniques that explain a complex model without greatly sacrificing accuracy. For example, combining a deep network with a small linear explanation layer, or compressing decision logic into simpler forms.
New methods like concept-based explanations (showing learned high-level features) and counterfactual explanations (showing how to change an input to flip the outcome) also promise insights.
Understanding Text and Vision:
Interpreting language and images poses unique problems. In NLP, attention weights or LIME on word embeddings can help, but it’s still hard to convey meaning in plain language. In vision, saliency maps and heatmaps (like Grad-CAM) are common, but they can be noisy or misleading if not used carefully.
Solution:
Better explanation techniques are emerging. For images, methods like SmoothGrad or Guided Backprop produce clearer heatmaps. In language, generating natural-language justifications or example-based explanations is an active research area.
Importantly, there’s growing recognition that explanations themselves must be validated (e.g. via user studies or metrics) to ensure they are faithful to the model, and not just plausible stories.
Evaluating Explanations:
It’s hard to know if an explanation is good or truthful. An explanation might sound reasonable but not reflect the model’s real logic.
Solution:
Researchers are developing tests (like sensitivity tests or comparing different XAI methods) to check explanation fidelity.
Some teams propose human-AI “games” where seeing an explanation should help a human predict what the AI will do on new cases.
This area (XAI evaluation) is still evolving, and it’s an open challenge.
In short, the main roadblocks are the model’s complexity and the need to not hurt performance. The field is tackling them by inventing new explanation methods (post-hoc and by-design) and by integrating explainability into model development.
For example, some approaches design neural nets to produce “self-explanations” (each node or layer has a clear meaning). Others focus on making explanations more user-friendly (visual, textual, or interactive). As one data science article puts it: explainable AI is now “a powerful mitigating force” that helps manage black-box risks.
Comparison of Methods
XAI methods come in different flavors. It helps to know the spectrum:
1. Model-Agnostic vs. Model-Specific
Aspect | Model-Agnostic | Model-Specific |
Definition | Treats the model as a black box; only uses input-output behavior | Uses the internal structure of the model for explanations |
Examples | LIME, SHAP Kernel, Permutation Importance | Grad-CAM, Integrated Gradients, TreeInterpreter |
Applicability | Works with any model (neural nets, ensembles, trees, etc.) | Limited to certain model families (e.g., neural networks, decision trees) |
Strength | Flexible, broad applicability | More precise and tailored explanations |
Limitation | May be less accurate or coarse | Cannot generalize across model types |
2. Local vs. Global Explanations
Local Explanation
Scope: Focuses on a single prediction.
Analogy: Like asking, “Why did the doctor prescribe this treatment for this patient?”
Example: LIME explanation for one patient → “High cholesterol and age pushed the model to classify them as high-risk.”
Global Explanation
Scope: Looks at the overall behavior of the model.
Analogy: Like analyzing, “What factors usually influence doctors’ treatment decisions across all patients?”
Example: SHAP summary plot → “On average, age and cholesterol are the strongest drivers of high-risk predictions.”
Together: Local is about “this case” while Global is about “the big picture.”
In practice, it’s wise to use both: a local view to debug or justify one case, and a global view to understand patterns in the entire dataset.
For example, you might check the SHAP summary plot for overall important features, and the SHAP force plot for one specific loan applicant to see exactly why they were accepted or denied.
3. Post-hoc vs. By-design
Post-hoc Methods
Can explain any trained model (LIME, SHAP, Grad-CAM)
Flexible and widely used
Explanations may not perfectly match the true reasoning of the model
Adds complexity after training
By-design Models
Transparent from the start (linear models, small decision trees, prototype-based networks)
Easier for stakeholders to trust without extra tools
May sacrifice accuracy for interpretability
Less powerful for highly complex data
There’s a spectrum here: some approaches combine them (e.g. a neural net constrained to use prototype images, or trees with monotonic constraints).
In summary, no single XAI method is best for all cases. The choice depends on your model and what you need (local justification vs global insight). But it always boils down to one of these categories, making it easier to pick the right tool.
Bias & Fairness
One of the biggest promises of XAI is spotting and fixing bias. Because explainer lays bare the model’s logic, it can reveal if the model is unfairly using sensitive attributes. For example, if a credit model is (incorrectly) relying on a customer’s race or ZIP code proxy, a SHAP explanation might show “race = black” is the top reason for denial. Then we can go back and remove or rebalance that input.
Studies confirm this power. One research review notes that XAI techniques can be leveraged to identify, mitigate, and prevent bias in AI systems. In practice, data scientists use XAI to audit models: they generate explanations on many instances and look for patterns. If certain groups consistently get disadvantages (e.g. lower scores), that flags a problem. By contrast, a black-box model could silently discriminate without anyone noticing. With XAI, experts can intervene. For instance, by re-weighting training data, adding fairness constraints, or re-thinking features, to make outcomes fairer.
In healthcare, XAI has revealed real biases. A famous case (not directly XAI but related) is when a medical risk model was found to under-serve Black patients because it used healthcare costs as a proxy for health; an explainability analysis could have pointed out that race was implicitly influencing scores.
Similarly in finance, XAI is used to ensure compliance: explainers help check that credit models aren’t indirectly using prohibited attributes.
Overall, XAI promotes accountability. By making decision factors explicit, it helps designers and regulators see if a model is fair. One study even showed that explaining a model to humans led to fairer judgments by those humans.
In short: if a model shouldn’t depend on a certain factor (like race or gender), an XAI tool will likely reveal that dependency so it can be removed. This translates to more equitable, trustworthy AI in the real world.
Visual Guides in Explainable AI Services
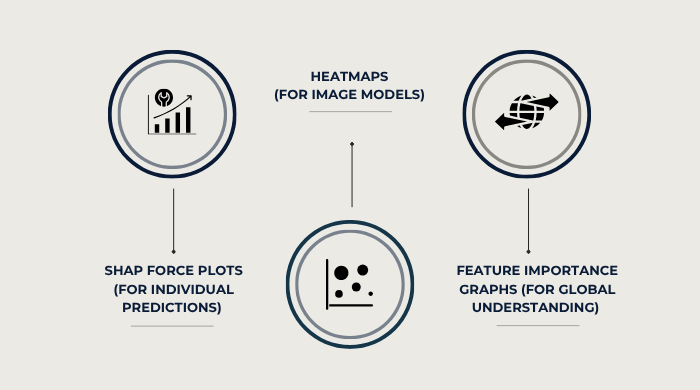
Explanations aren’t just text or numbers; they often become far more intuitive when shown visually. XAI offers several visual tools that translate complex model behavior into graphics people can interpret. Three of the most common are heatmaps, SHAP force plots, and feature importance graphs.
Heatmaps (for Image Models)
For computer vision tasks, heatmaps or saliency maps (from methods like Grad-CAM or Guided Backprop) show where a model focused when making a prediction. These overlays color regions of the image by their influence:
Red areas increase confidence in the prediction.
Blue areas decrease confidence.
For example, if a model classifies an image as a “speedboat,” the heatmap may highlight the hull in red, revealing which pixels drove the decision. In medical imaging, heatmaps highlight potential tumors or lesions on an X-ray, helping doctors validate whether the AI’s “attention” aligns with medical knowledge.
Heatmaps answer the question: “Which parts of the image mattered most to the AI?”
SHAP Force Plots (for Individual Predictions)
When working with tabular or structured data (e.g., credit scores, medical records), SHAP force plots break down a single decision. These plots look like a horizontal bar where features act as “pushes”:
Red pushes to the right = the feature increases the prediction value.
Blue pushes to the left = the feature decreases it.
For instance, a credit approval model might show that “High income” strongly pushed approval upward, while “High existing debt” pushed against approval. The base value (the average model output) serves as a starting point, and each feature nudges the decision higher or lower.
Force plots answer: “Why did the AI make this specific prediction?”
Feature Importance Graphs (for Global Understanding)
For a broader view, feature importance charts rank variables by their overall influence across the dataset. These bar charts (or SHAP summary plots) reveal the most predictive factors on average.
For example, in a healthcare model, a chart might show that “Age” and “Blood Pressure” consistently have the largest impact on predictions. While less granular than local explanations, these visuals are vital for spotting the model’s main drivers.
Feature importance answers: “What features generally drive the AI’s predictions?”
Bringing It All Together
Each visual serves a distinct role:
Heatmaps show attention in images.
Force plots break down one decision.
Feature importance charts highlight big-picture trends.
Together, these turn AI’s abstract math into pictures and charts that humans can inspect, making the AI’s reasoning much clearer.
Legal & Ethical Frameworks
Explainability isn’t just a nice-to-have. It is required by law in many places.
GDPR Laws
For example, the EU’s GDPR includes language that has been interpreted as a “right to explanation.” Recital 71 of the GDPR states that data subjects should have “the right … to obtain an explanation of the decision reached” when significant automated decisions affect them.
In practice, this means institutions must provide understandable reasons when an algorithm denies, say, a loan or benefits. Similarly, many US laws (like the Equal Credit Opportunity Act) already require creditors to explain denials with specific factors, a requirement that XAI can directly fulfill.
AI Act
The new EU AI Act (currently being finalized) further cements explainability. It explicitly defines transparency as making AI systems “developed and used in a way that allows appropriate traceability and explainability,” along with informing users of the system’s capabilities and limitations.
In short, high-risk AI (like in healthcare or finance) will legally need to be auditable and its decisions explainable.
These regulations reflect a broader principle: algorithms that affect people’s lives must be accountable. XAI provides the technical means to meet these obligations.
By design, any AI system under GDPR/AI Act regimes must have tools (like LIME/SHAP or clear model logic) that let humans understand its decisions.
In effect, laws are pushing the industry toward more transparency, exactly what XAI aims to achieve.
Future Outlook
Interest in XAI is accelerating as AI spreads. Key directions include:
Human–AI Teaming: Studies show XAI improves collaboration. Future research will test explanation styles (visual, textual, counterfactuals) across domains like finance, healthcare, and driving.
Transparency in Large Models: New methods are emerging to explain LLMs and vision transformers, including interactive “why” interfaces for end users.
Standardized Evaluation: Benchmarks and metrics will assess whether explanations truly help people make better decisions.
Regulatory & Ethical Push: Laws like the AI Act and global ethics guidelines will enforce transparency, especially in high stakes use cases.
The future of XAI is richer, more practical explanations, designed not just for data scientists, but for everyday users. The goal: AI that performs well and communicates its reasoning clearly.
Explainable AI Services – Insights into Decision-Making
The shift from black-box AI to explainable AI services is necessary at enterprise-level, if businesses want to leverage the technology to improve their operations. With the best AI development company – MoogleLabs, by your side, you can take the next step towards making AI an integral part of your operations.
Contact them today.
Loading FAQs
Please wait while we fetch the questions...